nvtx - Annotate code ranges and events in Python
nvtx gives your tools to annotate your Python code
(or automatically annotates it for you).
Annotated code can be analyzed and visualized by third-party applications such as
NVIDIA Nsight Systems.
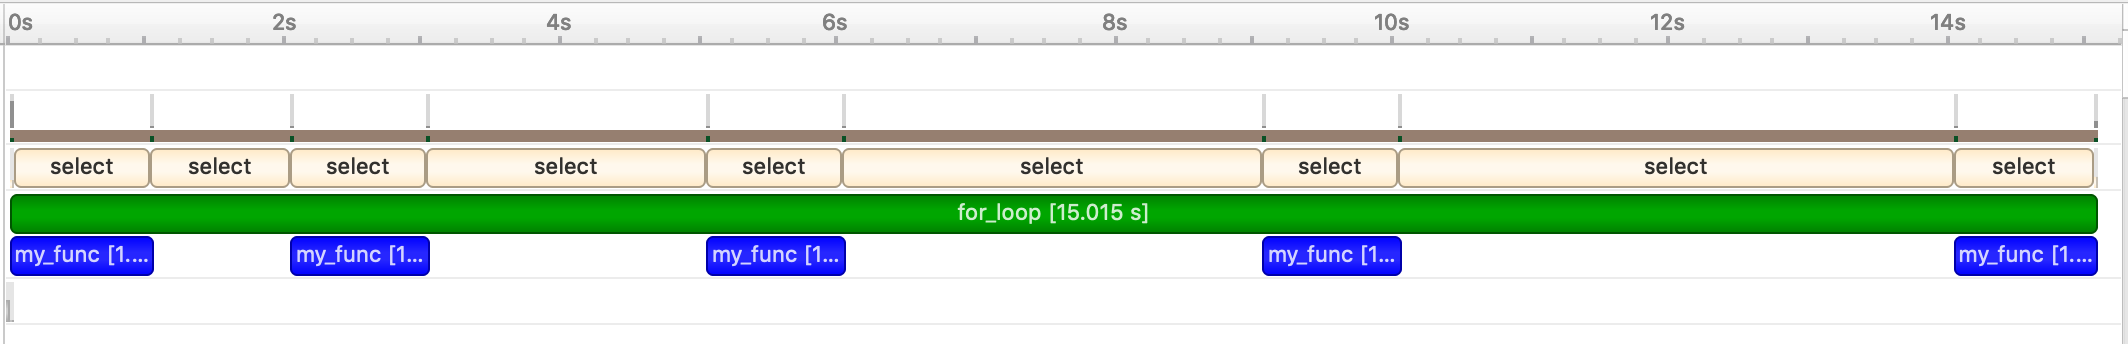
For example, you can produce detailed timelines of execution
of Python programs annotated with nvtx:
Quick Demo
Here is an example of using the annotation tools provided by nvtx:
# example_lib.py

import time
import nvtx


def sleep_for(i):
    time.sleep(i)

@nvtx.annotate()
def my_func():
    time.sleep(1)

with nvtx.annotate("for_loop", color="green"):
    for i in range(5):
        sleep_for(i)
        my_func()
Adding annotations to your code doesn’t achieve anything by itself. To derive something useful from annotated code, you’ll need to use a third-party application that supports NVTX annotations. The command below uses the Nsight Systems command-line interface to collect information from the annotated code:
nsys profile python demo.py
This produces a .qdrep file containing information about the annotated code.
Opening that file in the Nsight Systems GUI,
you can see a timeline of execution of your program: